Revealing 2023’s Top New Home Builders & Their Paths to Success – Webinar Replay
Builder
Frame
A series of regional events where market experts gather and present localized real estate data intelligence.
Live
|
REGIONAL
Builder
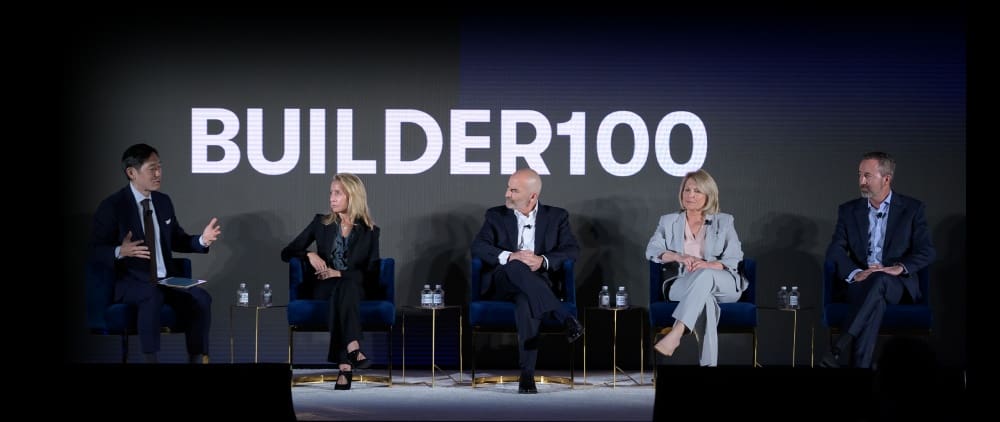
Builder 100 Leadership Summit
Explore the future of homebuilding at Builder 100 Leadership Summit.
Live
|
Dana Point, CA
May 6-9, 2024
$2,295
Dealmakers
Dallas Dealmakers
Explore the future of Dallas housing. Join us to get insight on the economic outlook for 2024.
Live
|
Dallas, TX
October 9, 2024
Livabl
Elevate
An exclusive event that explores the art of high rise living.
Live
|
Miami Beach, FL
December 9 - 11, 2024